Friday, April 5, 2013

Mock Trading: 2 Equity Allocation

Second part of the mock trading involves allocation of the equity. The details below is what we did in choosing the stocks and its weights.

Fund Size Description and Client Requirements - This contains the necessary requirements for the fund. This is necessary as policy statement goes.

Philippine Stock Market Outlook - As we recall, we found out that Consumer Staples, Utilities, Financials, Real Estate and Tourism are the sectors that are favorable to invest in. Moreover, analyzing the PSEi risk return statistics using monthly rolling annual log returns, each sector has something to give as the stock market today is very attractive. Applying the optimizer, by minimizing the variance subject to the constraints by the fund and client requirements and expected return greater than 15%, we found out that it is advisable to invest in Holding firms, Mining and oil and Services.

Stock Selection Screening - Furthermore, we analyzed each stock per sector that is found in the PSE. The bullets below are the things that we did in our analysis.
  • Fundamentals - we analyzed each of the stocks by using different ratios based on whether the stock is Cheap or Not, its Liquidity, Leverage, Growth and if it pays Dividend or not. Also, specific ratios are used depending on what sector we are analyzing. ie. for banks, we used P/B as for holding firms we used P/B and P/E.
  • Technicals - we just looked at the periods from 2007 onwards whether the stocks  is a bull or in the bear market
  • Risk Return Statistics - here we looked at the volatility, mean return and the sharpe ratio like what we did above in the Phil Stock Market outlook. 
  • Other Analyst Consensus - we also considered other analyst consensus using Reuters.
  • Optimization per Sector - same as Phil stock market outlook, we use the optimizer in each stocks per sector to minimize risk subject to the return greater that 15% and fund and client requirements. It determines the possible weights for each stocks and the stocks that we can pick for the investment. 
After all the analyzing, we found out that some of the weights considered in the optimization did not coincide to the other analyses. As such, we override the values of the optimization as to give in to the consideration mostly on the fundamentals. With so much contemplation, we choose stocks in the PSEi and added more stocks that we think are attractive. We did this so that we really have a very diversified portfolio. Also, we based our weights on the Stock Screening Process and the Portfolio manager had the final say. Final picks and weights are in Slide 14 to 16. 

In choosing those stocks, we are glad to report that after doing the correlation matrix, most of them are uncorrelated and we had a portfolio return of 24.66, which is above the said requirements. 

Wednesday, April 3, 2013

MockTrading: 1 Macroeconomy

Happy April Fools Day!!! :D

So far, I've been busy with other stuff that I didn't have the time to write. This is some of what my group and I have been doing for the past two weeks, tsp related. :)

Written below is the complete write-up of what we have researched for the macroeconomy for the mock trading.


Global Outlook 

  •  Advance Economies and EuroZone growth rate is consistently below world growth rate.
  • USA growth rate is above world growth rate for 2000 – 2008, but drastically went down on 2009 due to the crisis and recovered following the world growth rate in the next few years.
  • Developing Asia’s growth rate is consistently the highest.
  • Comparing GDP growth of per country group to Philippines shows that the Philippines has been performing better in years.
  • Growth rate of the per counter group is expected to rise for about 1 to 2 percent for 2013 -2017.
  • Barring major geopolitical shocks, the world economy in 2013 should mark the beginning of sustainably faster growth with declining trade imbalances.
  • Expansionary monetary policies will continue to drive the cyclical upturn in the United States and in the euro area, despite significant headwinds from fiscal consolidation.
  • Economic activity in Latin America will strengthen. With an estimated current account deficit of nearly $80 billion, this area is making a net contribution to world economic growth.
  • East Asia will remain the fastest growing segment - and the largest surplus unit - of the world economy. Unfortunately, a good part of that growth will be on the back of its trading partners. East Asia sells $270 billion more than it buys from the rest of the world. Its huge excess savings will continue to be a source of finance to deficit countries.
  • Philippines is expected to outperform most other nations in Asia and enjoy another year of strong economic growth. Philippine economy is forecast to expand 6.2 % in 2013 on strong domestic consumption, improved global financial conditions, and recovery in exports.

Philippine Economy

  • The Philippine economy was one of the global star performers in 2012 with growth accelerating over 6%, well above the 3.9% in 2011 and above the average over the last 10 years (5%). In 2013, the Philippine economy is expected to grow by around 6% on the back of sound policy developments and strong underlying fundamentals.
  • Philippines is also as “the diamond of the region” by an RBS economist in November has been proudly replayed by media and policy-makers alike.
Economic Indicators

  • Gross Domestic Product
    • Gross Domestic Product (GDP) grew by 6.8 percent in 4Q2012, paving for the full-year GDP estimate to post a broad-based growth of 6.6 percent. 
    • Increase was fuelled by robust performance of th e Services sector as well as the substantial improvements of Manufacturing and Construction.
    • GDP is expected to grow above 5% in the coming years, mainly coming from buoyant public and private spending.
  • Inflation
    • Year-on-year headline inflation for the whole year of 2012 averaged 3.2 percent well within the Government's target range of 3-5 percent for the year.
    • Inflation is expected to remain within the BSP’s target of 3% - 5% in the next few years. 
  • Unemployment
    • Unemployment rate improved in 2011 at an average of 7% compared to 7.4% in 2010.  Growth in job creation outpace growth in labor force. Meanwhile, the unemployment rate is expected to hover around 4%.
  • External Balance
    • Current account continued to register a surplus at US$1.8 billion, equivalent to 2.9 percent of GDP but 15% lower than the surplus of US$2.1 billion in 2010. 
    • Surplus in the current account was sustained by net receipts in current transfers, services and income, which offset the widening trade-in-goods deficit. 
    • Current account is expected to remain in surplus on the back of strong inflows from OFWs and receipts from the growing BPO industry
  • Fiscal Balance
    • Fiscal deficit in 2012 amounted to P424.8B equivalent to 2.3% of GDP below the 2.6% target.
    • Phils. making progress in tackling fiscal challenges – inadequate tax collection and chronic under spending.
    • Government has continued to demonstrate prudence in its fiscal management, as characterized by low budget deficits (less than 3% of GDP)
  • Interest Rates
    • Policy interest rates, overnight repurchase (repo) rate and reverse repo rate, were kept on hold, at 5.5% and 3.5%, respectively, since October 2012.
    • Yields on government papers fell to record lows due to investor strong demand on the back of the country’s solid fundamentals
    • The market is expecting a 25bps rate hike in 2013. Nevertheless, interest rates are expected to remain at or slightly above current levels.
  • Exchange Rates
    • Peso emerged as Asia Pacific’s 2nd best performing currency against the dollar in 2012 due to continued influx of foreign funds
    • Measures to temper capital inflows include ban on foreign funds in SDA and cap on non-deliverable forwards (NDF)
    • The peso is expected to appreciate further on strong inflows from OFWs, the BPO sector, foreign direct investment and portfolio investment flows (hot money).

Growth Drivers

  • Summary of Key Drivers
    • Conditions are ripe for spending (both from the public and private sectors)
    • Inflation in check, interest rates to remain low, liquidity abound
    • Sustained consumer spending and increased investment spending from the private sector
    • Government spending on infrastructure and socio-economic programs
  • Conditions are ripe for spending
    • Interest rates expected to remain low as there is a continued downward trend of the 10-yr. T-bond yield 
    • Liquidity is abound
    • Domestic liquidity (M3) grew by 10.6% yoy in Dec. ‘12 to reach P5.2 trillion
    • Growth in money supply (M2) driven by expansion in net domestic assets
    • Improved NPL ratio resulting in more funds available for lending making the banking sector is sound
  • Election Related Spending
    • In 2013, expenditure is likely to be propped up by election-related spending for the May mid-term poll. Continued slow progress on flagship public-private partnership scheme of the president will dampen spending growth.
  • Consumer Related Spending
    • Robust consumer spending on the back of strong inflows from OFWs and receipts from the growing BPO industry
      • OFW remittances up 7.2% to new record $ 20.12 B in 2011 amid political turmoil in some parts of MENA and slowdown in global economic growth
      • Remittances remained resilient due to sustained foreign demand for skilled Filipino manpower and financial service innovations of banks
      • OFW remittances are likely to still expand by 4-5% as the demand for Filipino workers abroad remains vibrant. Be¬sides, OFWs tend to remit more dollars to compensate for a peso appreciation in order to meet the peso bud¬gets of their families in Philippines. Q1 2013, however, will likely exhibit a slowdown from the previous quarter, as the OFWs tend to save up for months. 
      • With strong OFW remittances and portfolio capital in¬flows, the natural tendency will be for the peso to ap¬preciate particularly in Q1. However, this will be tem¬pered by BSP’s actions—further buildup of international reserves, more macroprudential measures, a further 25 bps cut in policy rates, among others—and by a larger trade deficit, which will emerge from stronger capital goods imports and larger imports of crude oil as a result of faster economic growth. 
    • IT-BPO services serve as catalysts for growth, the industry played a major role in fueling recent economic development in the Philippines
      • IT-BPO revenue reached $11B in 2011 24% higher than 2010.
      • BPAP 5-yr. plan to grow at an average of 20% a year – above the projected global annual growth rate of 10-15%
  • Credit Rating Upgrade
    • Upgrades in indicators of competitiveness and sovereign ratings reflect an improved investment environment.
      • S&P raised its outlook on the Phils.’ credit rating to “positive” from “stable”. 
      • Current administration possesses a level of legitimacy, support and stability that reduces political uncertainty and allows for improved legislative efficiency. This environment allowed the government to focus its efforts on improving its revenues, building infrastructure and reducing poverty. 
      • Credit rating may be raised from “BB+” to investment-grade by end-2014. The case for investment grade is supported by a number of factors, including a resilient economy, a current account surplus, stable fiscal policy, and the narrowing of the budget deficit. 
  • Philippine Stocks to outperform its peers
Risk Factors

  • Fiscal deficit is expected to narrow gradually over the next few years.
  • Fiscal consolidation would continue especially with the implementation of the "sin tax" in January. 
  • Policy rates will remain unchanged at 3.50% given robust growth outlook and a manageable inflation. Possible policy rate hike by 25 bps in Q4. 
  • Further SDA rate cuts can’t be ruled out, which would give central bank more freedom to manage FX volatility.
  • Inflation may accelerate, particularly in 4Q2013, due to higher food and energy inflation, consumer spending, and base effects but will remain manageable and unlikely to breach the inflation target.   

Preferred Sectors for Stock Pics

  • Consumer Staples
  • Utilities
  • Financial
  • Real Estate
  • Tourism

Summary/Other notes

  • With the year ending at a high note, and prospects both at home and abroad looking a bit better, we think that 2013 would show an acceleration in growth by as much as 8%, assuming the peso does not appreciate to below P40/$. 
  • As the most recent job figures tend to be ambivalent, and the election preparations heat up starting December, we expect a further acceleration of growth in H1 of 2013. 
  • Inflation is likely to continue at 3% or lower for most 2013, with food supply remaining abundant, while crude oil prices held down by rising U.S. oil and gas output from shale, and from Canadian tar sands. Due to base year effects, Q1 may see inflation average at 3%, but the trend would be downward in subsequent quarters. We expect full-year inflation to average 2.8%. 
  • The fiscal sector will continue to provide higher spend¬ing for infrastructures and other capital outlays, albeit at a slower pace, between 15% and 20% for the year. However, this growth will still be above 20% in H1 considering that the Department of Public Works and Highways (DPWH) would have unspent funds of some P40 B that will be used up in H1 2013. Besides, the fiscal sector’s consolidation will continue as a result of the passage of the Sin Tax reform law and more robust tax collections of the BIR arising from faster growth and better tax ad-ministration. 
  • Monetary policy will be neutral to easy, as the low inflation allows the BSP to further cut the interest differential between peso instruments and foreign debt papers. A smaller differential would reduce foreign portfolio inflows, and lessen losses of the BSP (which is huge for every peso of appreciation, due to its large amount of foreign exchange reserves). 
  • Exports are likely to gain by 10%, not only because the U.S. and China are more recently showing signs of gains, but also because of the inward flow of manufacturing facilities into the country by Japanese and Korean firms. Besides, electronics exports seem to have bottomed out, and a resurgence would be more apparent in Q1 2013. 
  • OFW remittances are likely to still expand by 4-5% as the demand for Filipino workers abroad remains vibrant. Besides, OFWs tend to remit more dollars to compensate for a peso appreciation in order to meet the peso budgets of their families in Philippines. Q1 2013, however, will likely exhibit a slowdown from the previous quarter, as the OFWs tend to save up for months. 
  • With strong OFW remittances and portfolio capital in¬flows, the natural tendency will be for the peso to appreciate particularly in Q1. However, this will be tempered by BSP’s actions further buildup of international reserves, more macroprudential measures, a further 25 bps cut in policy rates, among others and by a larger trade deficit, which will emerge from stronger capital goods imports and larger imports of crude oil as a result of faster economic growth. 

References

  • http://www.cnbc.com/id/100347707/Why_2013_Will_See_Faster_Stronger_Global_Growth 
  • http://philippinebritish.com/outlook/philippines-economy-2013-outlook 
  • http://www.adb.org/countries/philippines/economy
  • http://www.moodys.com/research/Moodys-assigns-positive-outlook-on-Philippines-sovereign-credit-rating--PR_247006 
  • www.bloomberg.com
  • http://www.imf.org/external/pubs/ft/weo/2012/02/weodata/index.aspx 
  • http://www.bsp.gov.ph/publications/media.asp?id=3070 

VBA: Getting Data From Bloomberg

This is what we did last time:
  • Open bloomberg site. This is where we are going to get out data from.
  • On Excel, Go to Data -> Get External Data -> From Web
  • A New Web Query box will appear. It is like a browser so we input in the url of bloomberg site we want to copy
  • Make sure that the Show Icons button is checked. It is beside the Refresh button, then click Import. A text format of the site will be imported in an Excel Sheet.
On GetData.xlsm, Sheet1.5, This is the data from sir. The exercise involves creating a macro that shows the recent price now, importing from bloomberg. And we want the refreshed data to be put in column B. Sheet1 would be useful because that is where we are going to find our data

Sheet2 is where I put my answers. Sheet3 contain all excess codes. It can be written as one Sub, but the challenge of this exercise is to create multiple sub or functions, instead of just creating loops.

How the code works

When the refresh button is pressed, the code gets data from bloomberg and imported it into a new sheet I called ws. It also assumes that the index name is on the first row and its values are in the second row when imported. Output is on Sheet2 and the ws worksheet will be deleted.

  • Sub Calling(ws) - imports data from bloomberg
  • Sub Refresh() - works like a Sub test(), it create a new worksheet, calls Calling(ws) that imports data from bloomberg, find the data needed and put it on the second column.
  • Function GetData(inFind, ws)- looks for data in ws and get the appropriate value next to it
New to the Code
  • I actually learned how to import data from bloomberg! Sub Calling contains such code
  • Doesnt show alert box - Application.DisplayAlerts = False
  • Delete the worksheet ws - ws.Delete
  • Show alerts box -  Application.DisplayAlerts = True
  • To stop updating the screen - Application.ScreenUpdating = False
  • Gets the index of the last row - Lastrow = Cells.Find("*", [A1], , , xlByRows, xlPrevious).Row
  • Gets the index of the last column - Lastcol = Cells.Find("*", [A1], , , xlByColumns, xlPrevious).Column
The Code

Sub Calling(ws)
'
' Getting data from bloomberg,
    
    With ws.QueryTables.Add(Connection:= _
        "URL;http://www.bloomberg.com/markets/stocks/world-indexes/americas", _
        Destination:=ws.Range("$A$1"))
        .Name = "americas"
        .FieldNames = True
        .RowNumbers = False
        .FillAdjacentFormulas = False
        .PreserveFormatting = True
        .RefreshOnFileOpen = False
        .BackgroundQuery = True
        .RefreshStyle = xlInsertDeleteCells
        .SavePassword = False
        .SaveData = True
        .AdjustColumnWidth = True
        .RefreshPeriod = 0
        .WebSelectionType = xlEntirePage
        .WebFormatting = xlWebFormattingNone
        .WebPreFormattedTextToColumns = True
        .WebConsecutiveDelimitersAsOne = True
        .WebSingleBlockTextImport = False
        .WebDisableDateRecognition = False
        .WebDisableRedirections = False
        .Refresh BackgroundQuery:=False
    End With
    
End Sub

Sub Refresh()
    
    Application.ScreenUpdating = False
    
    Dim ws As Worksheet
    Set ws = Sheets.Add
    
    Call Calling(ws)
    
    Sheets("Sheet2").Range("B1") = Evaluate("Now()")
    
    For x = 3 To Sheets("Sheet2").Range("A1").End(xlDown).Row
        inFind = Sheets("Sheet2").Range("A" & x).Value
        Sheets("Sheet2").Range("B" & x).Value = GetData(inFind, ws)
    Next x
    
    Sheets("Sheet2").Activate
    
    Application.DisplayAlerts = False
    ws.Delete
    Application.DisplayAlerts = True
    
End Sub

Function GetData(inFind, ws)

    'This assumes that the first row has the Index Names and it second row contains the values.

    Lastrow = Cells.Find("*", [A1], , , xlByRows, xlPrevious).Row
    Lastcol = Cells.Find("*", [A1], , , xlByColumns, xlPrevious).Column
      
    For i = 1 To Lastrow
        IndexName = ws.Range("A" & i)
        If IndexName = inFind Then
            GetData = ws.Range("B" & i)
        End If
    Next
End Function

Friday, March 15, 2013

Userforms and Algorithm for Indiv Project

In class, we are to make an outline. As to how is our project supposed to work. Since I've done the logistics of the code for CRR tree and BS, I will continue on how am I supposed to ask data from the user and how am I supposed to show my output. The following slides are supposed to be my guideline for that. This is supposed to be a scratch userform

The picture below also show my initial input-output plan, and the proposed plan. I included this for the intention of not becoming lost along the way.
The initial plan:


The proposed plan


Thursday, March 14, 2013

VBA: OLS and SSE

This is a part of our class exercise. Also can be seen in the OLS and SSE excel file. The problem involved:
  •  Getting the results of the regression and find the regression estimate per row and compare with the actual, 
  • Computing for the error and the squared error
  • Displaying the results of regression and the sum of errors in a new worksheet
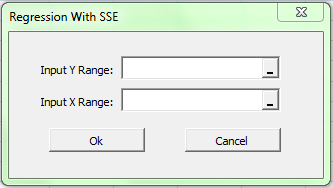
  • Creating a form for that,
  • And running the regression program dynamically
I reused and revised the code in the post Autoregression in functions, in particular the  Function OLS() to regress. In addition, I made up a form getting the data dynamically. Although test for errors were not included.

Functions and Subs
  • xM(x1) - Function that creates the x matrix
  • CommandButton1_Click() -serves as the test button or the Ok button. or also known as my input - output button because it determines what is your input and creates the output.
  • CommandButton2_Click() - the cancel button
  • OLS(y, x) - the revised OLS function. Its output are the betas
  • SSE(y, x) - solves for the SSE of the regressed y,x
Learning

I spent almost half of the class figuring out why the error mmult property cant run keeps popping up. and after a few hours I found out where I got it wrong. The logic of the code is correct but the parameters of the inputs are wrong. So lesson of the day is: Kung tama ang logic, at mali naman sa pinag gamitan. Mali pa rin yun. It works in real life.

The Form

Simple right :)

The Code


Private Sub CommandButton1_Click()
    y = Range(RefEdit1.Text)
    x1 = Range(RefEdit2.Text)
    
    'creating x matrix
    x = xM(x1)
    
    'regress
    param = OLS(y, x)
    
    'output Sheet
    Sheets.Add
    Range("A1") = "Solution Matrix"
    Range("A" & 2) = "Constant"
    For i = 2 To UBound(param)
        Range("A" & 1 + i) = "x" & i - 1
    Next i
    Range("B2").Select
    ActiveCell.Range(Cells(1, 1), Cells(UBound(param), 1)) = param
    Range("D1") = "Sum of Squared Errors"
    Range("D2") = SSE(y, x)
    
    Unload Me
End Sub

Private Sub CommandButton2_Click()
    Unload Me
End Sub

Private Function xM(x1)
    'adding ones to for coefficients in x matrix
    x = Range(Cells(1, 1), Cells(UBound(x1), UBound(x1, 2) + 1))
    For j = 1 To UBound(x, 2)
        For i = 1 To UBound(x)
            If j = 1 Then
                x(i, j) = 1
            Else
                x(i, j) = x1(i, j - 1)
            End If
        Next i
    Next j
    
    xM = x
End Function
    
Private Function OLS(y, x)
 'regression, getting betas and coefficient
 'given the matrix y and x
    
    xtrans = Application.WorksheetFunction.Transpose(x)
    xtx = Application.WorksheetFunction.MMult(xtrans, x)
    xtxinv = Application.WorksheetFunction.MInverse(xtx)
    xtxinvxt = Application.WorksheetFunction.MMult(xtxinv, xtrans)
    bsol = Application.WorksheetFunction.MMult(xtxinvxt, y)
    OLS = bsol
    
End Function

Private Function SSE(y, x)
    'sum of squared errors
    
    param = OLS(y, x)
    
    model = Application.WorksheetFunction.MMult(x, param)
    
    SumErrors = 0
    For i = 1 To UBound(x)
        SumErrors = SumErrors + (y(i, 1) - model(i, 1)) ^ 2
    Next i
    
    SSE = SumErrors
End Function

Saturday, March 9, 2013

Interest Rate Models

The class groups discussed two of term structure models: The Vacisek Model and the CIR term model.  These models are used to model interest rates.

What about the models:

  • equilibrium type of model
  • uses the Mean Reversion 
  • offer benefits since they are numerically quite simple and easy to solve with computers
  • very helpful in finding the important factors. 
  • interesting and widely tested empirically since they offer closed form solutions of their conditional and steady state density functions.
  • possible to get negative interest rates
Given the following:
  • $\Delta t = T-t$ 
  • $a$ as the speed of mean reversion
  • $\mu$ as the long run average rate
  • $r$ as the current state
  • $\sigma$ as the volatility
We can get the models:


CIR Model:
\[ P(t,T) = A(T-t)e^{-B(T-t)r}\]
where: \[ A(T-t) = \left [   \frac{2 \gamma e^{(a+ \gamma)(T-t)/2}} {(\gamma +a)(e^{\gamma (T-t)}-1} \right ]^{2ab/ \sigma^2} \]
and
\[ B(T-t) = \frac {2(e^{\gamma (T-t)}-1)}{(\gamma+ a)(e^{\gamma (T-t)}-1)+2 \gamma}\]


Vacisek Model:
\[ P(t,T) = A(T-t)e^{-B(T-t)r}\]

where: \[ A(T-t) = \text{exp} \left [ \frac{ ( B(T-t) - T+t ) (a^2b-\sigma^2/2)}{a^2} -\frac{\sigma^2 B(T-t)^2}{4a}\right ] \]
and
\[ B(T-t) = \frac {1-e^{-a(T-t)}}{a}\]

Comparing these two models, they have the same process only that the parameters $ A(T-t)$ and  $B(T-t)$ are different.


Sources: 

  • Hull book
  • Groups ppt. They simplified the process.

Friday, March 8, 2013

Monte Carlo: Antithetic and QuasiRandom

Please see: "Antithetic and QuasiRandom.xls"

As I have came to understand, the Antithetic and QuasiRandom is used to reduce the variances.

Antithetic technique:

  • Each time random variable r is drawn, its complement 1-r calculated and used to drive a parallel run of the simulation. This tends to lead to negatively correlated output values; hence lower variance
  • Example: this is from Monte Carlo - Antithetic and Quasi-Random.xls and it's quite direct to the point.
    • Table: The rand generates the random variable, and the randns generate the distribution. S1 solves $S_T$ of the simulation. S2 solves for antithesis of $S_T$ of the simulation. Then we get the payoffs for each S1 and S2. Then get the average payoff. Then we do it many many times. 
    • MC Value: Get the average of the avg pay and discount it to get the present value of the option. 

QuasiRandom technique:

  • We use Low Discrepancy Sequences to determine the random variables
    • Faure Sequence
    • Halton Sequence
    • Sobol Sequence
  • Inverse normal distribution
    • Box-Muller transform
  • Example: This is from Monte Carlo - Antithetic and Quasi-Random.xls 
    • Table: it uses Faure Sequence to determine the random variable, then Box-Miller transformation is used to determine the inverse normal distribution. Then we get $S_T$ for the share price and get the payoff.
    • MC Value: Get the average of the payoff and discount it to get the present value of the option. 

As can be seen in the graph below, Monte Carlo simulation, both Quasi and Antithetic Variate, converges to Black Scholes formula.


Source: Monte Carlo - Antithetic and Quasi-Random.xls